
Page 46 - Proceedings of the 2018 ITU Kaleidoscope
P. 46
2018 ITU Kaleidoscope Academic Conference
s
10. Calculate the starvation ratio P (Θ,ᴪ) as the ratio 6.1 Peak Signal to Noise Ratio (PSNR)
between the total starvation time and the total
display time defined as The calculation of PSNR depends on mean square error
s
P (Θ,ᴪ) = ( ,ᴪ) (27) with respect to the maximum pixel value in a frame. Even if
( ,ᴪ) there is no loss of data in the channel, still PSNR could not
11. Calculate the overall QoE formulated as be very high because server dynamically trims the original
s
QoE(Θ,ᴪ) = E(ᴪ) - w 1V(ᴪ) – w2P (Θ,ᴪ) (28) video as per the client feedback in order to improve QoE.
12. Communicate the overall QoE to the server. The observed PSNR during the experimental process for
13. Continue through steps 3 – 12 till streaming occurs.
three algorithms have been depicted in Figure 3. The
Double Sarsa – Softmax (DS-S) approach shows an average
5. IMPLEMENTATION ENVIRONMENT PSNR of 7% higher than QoE Driven Strategy (QD-S), and
12.7% higher than Double Sarsa – Greedy (DS-G) approach.
Eclipse IDE was used as the code development platform in The DS-S approach performs better compared to the other
Java programming environment based on 64 bit JDK two as it is able to adapt well in delivering higher quality
Version 8, as it is platform independent and supports VLCJ with varying network bandwidth conditions.
framework. Dshow API [20] was used to capture the live
video and processing it for streaming. The Java network 42
packet capture library jNetPcap [21] was used to capture
packets at the client. The server and client were connected 40
using Reliance 4G Jiofi 3 LTE Hotspot [22] as a means of 38 DS-G
wireless network. At the server, during encoding, the frame PSNR (in dB) 36
rate was varied between 20 to 30fps with the default rate as 34 DS-S
24fps, while adapted video resolutions were 240p, 360p,
480p, 720p and 1080p, confirming to ITU-T P.1203. The 32 QDS
server was implemented in Acer laptop with an Intel Core 30
i3 processor, 8GB RAM and Windows 8 64 bit operating 1 2 3 4 5 6 7 8 9 101112 131415 161718 1920
system. The client was implemented in Lenovo ThinkPad Frames #
laptop with an Intel Core i5 processor, 4GB RAM and
Windows 7 Professional 64 bit operating system. The Figure 3 – The PSNR measurement
network speed of the 4G Jiofi 3 LTE Hotspot dongle was
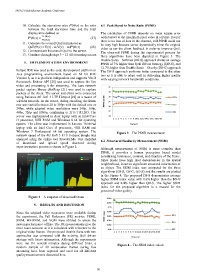
analyzed using the online tool Speedof.Me. One snapshot 6.2 Structural Similarity Measurement (SSIM)
of download and upload speed observed during
experimentation process is shown in Figure 2.
Although measurement of SSIM is more complex than
PSNR, it provides a human perception based model
considering luminance, contrast, and structure of the frame.
Since pixels have high inter dependencies in the spatial
neighborhood, it carries significant structural information of
an object. The SSIM index was computed for the three
algorithms (DS-S, DS-G, QD-S) and the results are plotted
in the Figure 4. The proposed DS-S demonstrates average
higher SSIM index value with 0.6% higher than the DS-G
approach and 0.4% higher than QD-S. The higher SSIM
index for the proposed algorithm is a reward for the
perceived video quality.
Figure 2 – A snapshot of observed bitrate 0.994
0.992
5. RESULTS AND DISCUSSION
0.99
Since the original video sequences were available during 0.988
the experiment, the Full Reference (FR) metrics: PSNR, SSIM values 0.986 DS-G
SSIM, MS-SSIM, and VQM were utilized to assess the 0.984
system performance offline. The FR measurements give the 0.982 DS-S
most exact outcome as it is calculated with reference to the 0.98 QDS
original video frames. The proposed Double Sarsa with two 12 3456789 10 11 12 13 14 15 16 17 18 19 20
approaches was compared with the existing QoE driven Frames #
strategy with future information. Although the experiments
were run for several minutes during different trials, a Figure 4 – The SSIM index values
random sample of 20 consecutive frames during live
streaming have been captured and used for all different
quality measurements discussed here.
– 30 –