
Page 28 - Proceedings of the 2018 ITU Kaleidoscope
P. 28
2018 ITU Kaleidoscope Academic Conference
Figure 6. QoXphere management model
Figure 5. QoS relationships, from Recommendation ITU-T
E.804 [6]. 4. MACHINE LEARNING METHODOLOGY
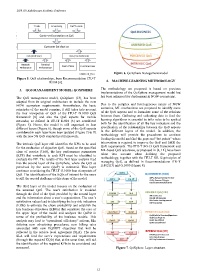
3. QOS MANAGEMENT MODEL: QOXPHERE The methodology we proposed is based on previous
implementations of the QoXphere management model but
has been enhanced for deployment in NGW ecosystems.
The QoS management model, QoXphere [13], has been
adapted from its original architecture to include the new
NGW ecosystem requirements. Nevertheless, the basic Due to the complex and heterogeneous nature of NGW
principles of the model remains; it still takes into account scenarios, ML mechanisms are proposed to identify some
the four viewpoints of QoS of the ITU-T G.1000 QoS of the QoS aspects and to formulate some of the relations
framework [8] and also the QoS aspects for mobile between them. Gathering and collecting data to feed the
networks, as defined in ITU-T E.804 [6] are considered learning algorithms is essential to infer rules to be applied
(Figure 5). Hence, the model is still organized in four both for the identification of all the key indicators and the
different layers (Figure 6), though some of the QoS aspects specification of the relationships between the QoS aspects
considered in each layer have been updated (Figure 7) to fit in the different layers of the model. In addition, the
with the new 5G QoS standardized framework. methodology will provide the procedures to continue
feeding the model and find the gaps and “hot points” where
intervention is required to improve the QoS and fulfill the
The intrinsic QoS layer still identifies the KPIs to be used
for the evaluation of objective QoS. Based on the specified QoE requirements. The ITU-T SG-13 QoS framework and
class of service (CoS), the key performance parameters ML-based QoS assurance, as proposed in [4, 12], have been
(KPP) that contribute to each KPI must be identified to taken into account when defining the proposed
evaluate the NP. The results of the first layer analysis feed methodology, together with the ITU-T SG-12 principles of
into the second layer of the QoXphere, where the QoS as managing QoS, as defined in Recommendations ITU-T
perceived by the users (QoP) is estimated. This layer E.802[13] and G.1000 (Figure 8).
continues considering the ITU-T G.1000 four viewpoints of
QoS. The identification of the KQIs of interest for the users QoSBUSINESS (KBO)
is still the crucial challenge at this stage of the model. ARPU: Average Revenue Per User
QoBiz: Revenue & Margin
Op-Eff: Operational Efficiency
The third layer of the model focuses on the evaluation of
the assessed QoS. The user's satisfaction is modeled
through the feed of the QoE provided by the second layer ASSESSED QoS (KRI)
and the information about a user´s expectations. The user’s SAT: Satisfaction
CHURN: Attrition Rate
satisfaction values lead to identifying the key risk indicators SLA: Service Level Agreement
EXP: Expectation
(KRIs) to estimate the churn probability and establish the
key business objectives (KBOs) that constitute the core of
the upper layer of the model and analyses the QoBiz in PERCEIVED QoS (KQI)
terms of the profitability of the business models. This QoP/QoE: QoS Perceived/Experience
QoSR: QoS Required
analysis may lead to “operational efficiency” actions, like QoSO: Qos Offered
defining new advertising procedures, new billing rates QoSD: QoS Delivered
associated with new KQI/KPI objectives that will be
reflected in the service level agreement (SLA). The new INTRINSIC QoS (KPI)
SLA will feed the user’s expectations and requirements NP: Network Performance
CoS: Class of Service
(through the required KQIs) that, at the same time, will aid KPP: Key Performance Parameter
the identification of the required KPIs to be considered and
measured. Figure 7. QoXphere: Layer structure
– 12 –