
Page 153 - Proceedings of the 2017 ITU Kaleidoscope
P. 153
Challenges for a data-driven society
tensity is estimated as distance is increased to a critical distance. The other trend is
that the critical distance shifted to right when the LED spac-
n−1 q 2
XX (qdf) ing distance d or the focal length f increases. The larger d
I SISIN = G 2n(n − q)exp −
2 2
2σ u the LED array has or the the larger f the lens have, the longer
q=1p=1 (11)
2 2 2 2 communication distance the system can be achieved. From
(q + p )d f
+4(n − q)(n − p)exp − the equation (6) and the equation (10), the increases of the
2 2
2σ u communication distance leads to the decreases of r , which
0
ij
will significantly increase the system’s SISI noise. It means
ξg jj · P LED · t e · πRa 02 that the critical communication distance of the MIMO-IS-
Where G = √ . The equation(11) is a
σ 2π VLC system is mainly affected by the SISI noise intensity.
0
summation of the total expectation I SISIN [r (n, q)]. There-
fore, the signal noise ratio (SNR) of the receiving termi-
n×n
P 2 2
nal can be calculated as R SN = [GP i (t)] /[I SISIN +
i=1
2
(ξK) ].
The MIMO-IS-VLC system can be considered as a Unipo-
lar On-Off key modulation system. From the paper [10] it
is known that the ISC system’s noise distribution complies
with Gaussian distribution and signal dependence. Assum-
ing that the constant stray light component K is equal to
the background noise light and the one-dimensional proba-
bility density of the signal sampling value is a Gaussian ran-
dom variable, the one-dimensional probability density when
transmitting signal ’1’ is expressed as
1 (x − P LED ) 2
f 1 (x) = √ exp − 2 (12)
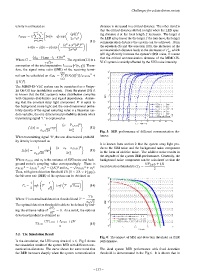
σ n 2π 2σ n Fig. 5: BER performance of different communication dis-
tances.
When transmitting signal ’0’, the one-dimensional probabil-
ity density is expressed as
It is known from section 2 that the system stray light pro-
1 (x − σ b − σ SISI ) 2 duces the SISI noise and the background noise component
f 0 (x) = √ exp − 2 (13)
σ n 2π 2σ n in the form of additive noise. The additive noise results in
the degrade of the system BER performance. Generally, the
Where σ SISI and σ b is the variance of SISI noise and back- background noise component can be calculated so that the
ground noise’s sampling value correspondingly. There is GP LED + ξK
√
2
2
2
2
σ SISI = I SISI , σ b = (ξK) and σ n = σ SISI + σ b . fixed detection threshold is T f = 2 .
2
2
Thus, with given detection threshold Th (0 < Th < P LED ),
the bit error rate (BER) of the system can be obtained as
" ! #
1 1 p
P e = erfc T − √ +erf T − R SN (14)
2 2
Th
Where T is normalized detection threshold and T = √ .
σ n 2
The optimal detection threshold is able to be defined by find-
∂P e
ing the extreme value of = 0. As a result, the optimal
∂T
detection threshold is obtained as
GP LED + I SISI + ξK
Th = (15)
2
3.2. The Simulation Result
Fig. 6: The impact of SISI and detection threshold on BER
In the simulation, the LED array size is 6 × 6. Fig.5 shows performance.
the simulation results of the system BER with different com-
munication distances. The curve shows the same trend that The ideal system BER performance with fixed detection
the BER increases sharply when the system communication threshold is demonstrated in the Fig.6. It is shown that in
– 137 –