
Page 137 - Proceedings of the 2017 ITU Kaleidoscope
P. 137
countries where there are active drone projects. This observation readiness-index.herokuapp.com/ (visited on 2017-10-12).
can be explained by the fact that the attributes with higher weights
such as communications, regulations, investments and projects are [2] Rwanda Biomedical Center, “Rwanda launches the first
usually achieved by countries where there are active drone drone medical deliveries project”,
projects. http://www.rbc.gov.rw/index.php?id=19&tx_ttnews%5Btt_
news%5D=134&cHash=e94620093a91427ba1143170c76f7
6. DISCUSSION f25 (visited on 2017-09-27).
Notwithstanding the novelty of the paper, the computation of the [3] Jeanneret, C., Rambaldi, G. (ed), “Drone governance: A
Drone Readiness Index has the following limitations which could scan of policies, laws and regulations governing the use of
affect the values of the computed Drone Readiness Index. unmanned aerial vehicles (UAVs) in 79 countries,” CTA
• We selected some sub-indices and indicators based on Working Paper, CTA, 2016.
qualitative data. In addition, quantifying these sub-
indices was sometime dependent on qualitative data. [4] S. Baller, A.D Battista, S. Dutta, and B. Lanvin, “The global
This can increase the sensitivity of the Drone Readiness information technology report 2016,” In World Economic
Index. If different and/or additional sub-indices and/or Forum, Geneva, pp. 1-307, 2016.
indicators were selected, different values of the Drone
Readiness Index could be expected. [5] Worldbank Data, “Gross enrolment ratio, tertiary, both
• The results of the computation are as good as the data sexes ),”
collected. If comprehensive data was available, the https://data.worldbank.org/indicator/SE.TER.ENRR (visited
10-10-17).
accuracy of the Drone readiness index would be higher.
In this study, we have experienced difficulty collecting
some data and therefore there are some data gaps, that [6] K. Schwab, “The global competitiveness report 2016–2017,
In WE Forum, 2016.
we expect to bridge in our future work. For example, in
the absence of the desired Mobile geographic coverage
indicator data for the communication and energy sub- [7] International Telecommunication Union (ITU), World
Telecommunication/ICT Indicators Database 2016.
index, Mobile-cellular telephone subscriptions /100 pop
was used. This emphasizes the need to optimize the
selection of the indicators used in the study to ensure [8] OZYRPAS Consulting, “Global Drone Regulation
Database”, https://www.droneregulations.info/ (visited on
accuracy of the results.
• The number of countries, for which the drone readiness 2017-09-27).
index was computed, was limited. This was partly due to [9] Design decisions wiki, “Swing weighting”,
difficulties in data collection. In the next phase, more https://wiki.ece.cmu.edu/ddl/index.php?title=Swing_weighti
data is expected to be collected from countries on ng&oldid=20904 (visited on 2017-09-27).
different continents, e.g., using crowdsourcing. Hence
we expect to extend the application of the Drone [10] Quartz, “Africa is now the world’s testing ground for
Readiness Index, and rank almost all countries. commercial drones”, https://qz.com/1003810/the-worlds-
• In our work, we used scores of 0, 0.5 and 1 for many of first-commercial-drone-delivery-operates-from-a-hill-in-
the sub-indices. However, the level of granularity can also rwanda/ (visited on 2017-09-27).
be increased by using a wider scale to provide greater
accuracy for the Drone Readiness Index. For example, if the [11] Reuters, “Drones help communities map flood risk in Dar es
same indicators were quantified using a gradation of 0.1 Salaam slums”, https://www.reuters.com/article/us-tanzania-
instead of 0.5 used in this paper, more differentiation would disaster-floods-drones/drones-help-communities-map-flood-
be expected for different countries. risk-in-dar-es-salaam-slums-idUSKBN14O0M8 (visited on
2017-10-10).
7. CONCLUSION
We proposed a novel drone readiness index that can be used to APPENDIX
evaluate the robustness of the ecosystem for drone projects in a
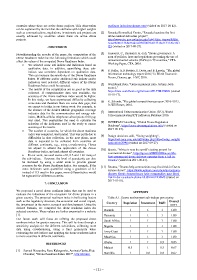
given country. The proposed readiness index is built using factors Table A.1. Scores environment sub-indices per country
such as the regulatory structure, the economic and social impact, Overall
the investment in the sector, research and development. Using the Country Regulation Investment R&D score
derived formula, we computed the drone readiness index for
selected countries. These values are further presented in a website Rwanda 1 1 1 1.00
[1]. Tanzania 1 1 1 1.00
Our future work will focus on refining the proposed drone South Africa 1 1 1 1.00
readiness index for greater accuracy. This will be done through a
sensitivity analysis for the different sub-indices, collecting more Nigeria 1 1 1 1.00
data using crowdsourcing, using a finer granularity when
evaluating the sub-indices and applying the drone readiness index Ivory Coast 1 1 1 1.00
to more countries in different continents. Mauritius 1 1 1 1.00
REFERENCES Ghana 1 1 0.5 0.83
Malawi 0.5 1 0.5 0.67
[1] Samuel Nzaramba, Rene Kabagamba, Aminata Garba, Kate
Chandler, “Drone Readiness Index 2017”, http://drones- Namibia 1 0.5 0.5 0.67
– 121 –