
Page 28 - ITU Indicators for Smart Sustainable Cities – Pilot project Singapore
P. 28
ITU Indicators for Smart Sustainable Cities – Pilot project Singapore
Sub- Singapore
Dimension Indicator KPI definition
dimension Reported Value
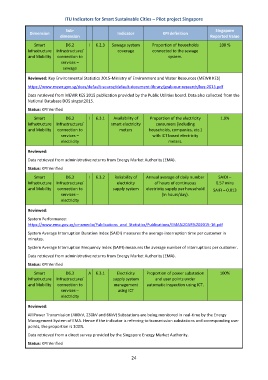
Smart D6.2 I 6.2.3 Sewage system Proportion of households 100 %
Infrastructure Infrastructure/ coverage connected to the sewage
and Mobility connection to system.
services –
sewage
Reviewed: Key Environmental Statistics 2015-Ministry of Environment and Water Resources (MEWR KES)
https://www.mewr.gov.sg/docs/default-source/default-document-library/grab-our-research/kes-2015.pdf
Data retrieved from MEWR KES 2015 publication provided by the Public Utilities board. Data also collected from the
National Database DOS singtat2015.
Status: KPI Verified
Smart D6.3 I 6.3.1 Availability of Proportion of the electricity 1.9%
Infrastructure Infrastructure/ smart electricity consumers (including
and Mobility connection to meters households, companies, etc.)
services – with ICT based electricity
electricity meters.
Reviewed:
Data retrieved from administrative returns from Energy Market Authority (EMA).
Status: KPI Verified
Smart D6.3 I 6.3.2 Reliability of Annual average of daily number SAIDI –
Infrastructure Infrastructure/ electricity of hours of continuous 0.57 mins
and Mobility connection to supply system electricity supply per household SAIFI – 0.013
services – (in hours/day).
electricity
Reviewed:
System Performance:
https://www.ema.gov.sg/cmsmedia/Publications_and_Statistics/Publications/EMA%20AR%202015-16.pdf
System Average Interruption Duration Index (SAIDI) measures the average interruption time per customer in
minutes.
System Average Interruption Frequency Index (SAIFI) measures the average number of interruptions per customer.
Data retrieved from administrative returns from Energy Market Authority (EMA).
Status: KPI Verified
Smart D6.3 A 6.3.1 Electricity Proportion of power substation 100%
Infrastructure Infrastructure/ supply system and user points under
and Mobility connection to management automatic inspection using ICT.
services – using ICT
electricity
Reviewed:
All Power Transmission (400kV, 230kV and 66kV) Substations are being monitored in real-time by the Energy
Management System of EMA. Hence if the indicator is referring to transmission substations and corresponding user
points, the proportion is 100%.
Data retrieved from a direct survey provided by the Singapore Energy Market Authority.
Status: KPI Verified
24