
Page 816 - Shaping smarter and more sustainable cities - Striving for sustainable development goals
P. 816
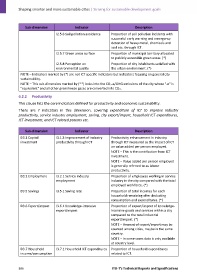
Sub‐dimension                 Indicator                            Description
                                   I2.5.6 Soil pollution avoidance   Proportion of soil pollution incidents with
                                                                    successful early warning and emergency
                                                                    detection of heavy metal, chemicals and
                                                                    acid etc. through ICT.

                                   I2.5.7 Green areas surface       Proportion of municipal territory allocated
                                                                    to publicly accessible green areas. (*)
                                   I2.5.8 Perception on             Proportion of city inhabitants satisfied with
                                   environmental quality            the urban environment. (*)
             NOTE – Indicators marked by (*) are not ICT specific indicators but indicators focusing on general city
             sustainability.
             NOTE – This sub‐dimension marked by (**) looks into the CO2‐e/GHG emissions of the city where "‐e" is
             "equivalent" and all other greenhouse gases are converted into CO2.

            6.2.2   Productivity
            This clause lists the core indicators defined for productivity and economic sustainability.

            There  are  7  indicators  in  this  dimension,  covering  expenditure  of  ICT  to  improve  industry
            productivity, service industry employment, saving, city export/import, household ICT expenditures,
            ICT investment, and ICT related patents etc.


                Sub‐dimension                 Indicator                            Description
             D3.1 Capital          I3.1.3 Improvement of industry   Productivity enhancement in industry
             investment            productivity through ICT         through ICT measured as the impact of ICT
                                                                    on value added per person employed.
                                                                    NOTE – This is the contribution from ICT
                                                                    investment.
                                                                    NOTE – Value added per person employed
                                                                    is generally referred to as labour
                                                                    productivity.

             D3.2 Employment       I3.2.1 Service industry          Proportion of employees working in service
                                   employment                       industry in the city compared with the total
                                                                    employed workforce. (*)
             D3.5 Savings          I3.5.1 Saving rate               Proportion of total incomes for each
                                                                    household remaining after deducting
                                                                    consumption and expenditures. (*)

             D3.6 Export/import    I3.6.1 Knowledge‐intensive       Proportion of export/import of knowledge‐
                                   export/import                    intensive goods and services within a city
                                                                    compared to the total industrial
                                                                    export/import. (*)
                                                                    NOTE – Amount of export/import may be
                                                                    counted among cities, maybe in the same
                                                                    country.
                                                                    NOTE – In some cases data is only available
                                                                    at country level.
             D3.7 Household        I3.7.1 Household ICT expenditures  Proportion of household expenditures
             income/consumption                                     related to ICT.


            806                                                      ITU‐T's Technical Reports and Specifications