
Page 745 - Shaping smarter and more sustainable cities - Striving for sustainable development goals
P. 745
power consumption data that preserves personal information can be given as an example. This
70
method converts data to distribution data by considering anonymity .
Here, as an example, a new anonymizing method for electric power consumption data. This method
anonymizes data using the following steps. First, this method generates clusters using ‐member
71
clustering . After member clustering, the average and width of each cluster can be extracted. By
using this parameter, existence probability can be generated from the average and width of each
cluster. At this time, the width is modified to control the anonymization level. After creating the
existence probability for all clusters, a convolution is given to all clusters. All existence probabilities
created from each cluster is summed up and transformed the area generated in this summation
process into 1.
In order to achieve DR, one major solution is to change the price of electricity or to provide
incentives to encourage customers to change their typical consumption pattern when electricity
demand is high. Using this anonymized electric power consumption distribution, a DR service can
be provided without obtaining raw data. From historical power trends of anonymized data, it is still
possible to predict electric power demand for the next 30‐min interval. When the predicted value
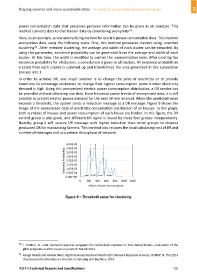
exceeds a threshold, the system sends a reduction message as a DR message. Figure 9 shows the
image of the anonymized data of electricity consumption distribution of all houses. In this graph,
both numbers of houses and power consumption of each house are hidden. In this figure, the DR
control group is also given, and different DR signal is issued by these four groups independently.
Namely, group 4 will receive DR message with higher reduction than other groups to observe
graduated DR for maintaining fairness. This method also reduces the total calculating cost of DR and
number of messages and occupation throughput of network.
4.00E‐03
3.50E‐03
Existence Probability 3.00E‐03
2.50E‐03
2.00E‐03
1.50E‐03
1.00E‐03
5.00E‐04
Group1 Group2 Group3 Group4
0.00E+00
0 200 400 600 800 1000 1200
Electric Power Consumption
Figure 9 – Threshold value for clustering
____________________
70 T. Hattori, N. Toda; Demand response programs for residential customers in the United States—Evaluation of the
pilot programs and the issues in practice; March 2011.
71 Kengo Okada and Hiroaki Nishi; Big Data Anonymization Method for Demand Response Services; ICOMP'14, The 2014
International Conference on Internet Computing and Big Data, 2014.
ITU‐T's Technical Reports and Specifications 735