
Page 38 - ITU Kaleidoscope 2016
P. 38
2016 ITU Kaleidoscope Academic Conference
Table 3. Overview of all the averages scores at each of the
participating organisations.
A B C D
Green ICT in the organisation
Green ICT Strategy 1,8 1,8 1,6 1,2
Governance of ICT services 2,6 3,8 2,6 2,8
Green ICT Procurement 2,1 2,6 2,1 1,8
E-waste Policy 2,2 3,2 2,3 1,4
Green ICT in Information Man- 1,7 2,0 1,4 1,4
agement and Architecture
Community collaboration 2,3 3,0 1,8 1,6
Green ICT Supply Chain Manage- 2,0 2,6 1,8 1,6
ment
Greening of ICT
Housing 2,0 2,2 1,8 1,6
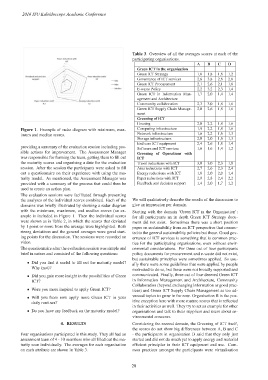
Figure 1. Example of radar diagram with minimum, max- Computing infrastructure 1,9 2,2 1,8 1,6
imum and median scores. Network infrastructure 1,6 2,2 1,6 1,3
Storage infrastructure 2,0 2,0 1,6 1,3
End user ICT equipment 2,4 2,6 1,8 1,4
providing a summary of the evaluation session including pos- Software and ICT services 1,6 1,6 1,4 1,2
sible actions for improvement. The Assessment Manager Greening of Operations with
was responsible for forming the team, getting them to fill out ICT
the maturity scores and organising a date for the evaluation Travel reductions with ICT 3,0 3,0 2,3 1,8
session. After the session the participants were asked to fill Area reductions with ICT 2,7 2,6 2,3 2,4
out a questionnaire on their experience with using the ma- Energy reductions with ICT 1,8 2,0 2,0 1,4
turity model. As mentioned, the Assessment Manager was Paper reductions with ICT 2,9 2,8 2,4 2,2
provided with a summary of the process that could then be Feedback and decision support 1,4 2,0 1,7 1,2
used to create an action plan.
The evaluation sessions were facilitated through presenting
the analyses of the individual scores combined. Each of the We will qualitatively describe the results of the discussion to
domains was briefly illustrated by showing a radar diagram give an impression per domain.
with the minimum, maximum, and median scores (an ex- Starting with the domain ‘Green ICT in the Organisation’:
ample is included in Figure 1. Then the individual scores for all participants an in depth Green ICT Strategy docu-
were shown as in Table 2, in which the scores that deviated ment did not exist. Sometimes there was a short position
by 1 point or more from the average were highlighted. Both paper on sustainability from an ICT perspective that connec-
strong deviations and the general averages were good start- ted to the general sustainability policies but those. Good gov-
ing points for the discussion. The sessions were recorded on ernance of ICT services is something that is common prac-
video. tice for the participating organisations, even without envir-
The questionnaire after the evaluation session was simple and onmental considerations. For three out of four participants
brief in nature and consisted of the following questions: policy documents for procurement and e-waste did not exist,
but sustainable principles were sometimes applied. So usu-
• Did you find it useful to fill out the maturity model?
ally there were some guidelines that were applied by people
Why (not)?
motivated to do so, but these were not broadly supported and
• Did you gain more insight in the possibilities of Green communicated. Finally, three out of four deemed Green ICT
ICT? in Information Management and Architecture, Community
Collaboration (beyond exchanging information or good prac-
• Were you more inspired to apply Green ICT? tices) and Green ICT Supply Chain Management as too ad-
vanced topics to grow in for now. Organisation B is the pos-
• Will you from now apply more Green ICT in your
itive exception here with more mature scores that is reflected
daily routines?
in their activities as well. They try to set an example for other
• Do you have any feedback on the maturity model? organisations and talk to their suppliers and users about en-
vironmental concerns.
4. RESULTS Considering the second domain, the Greening of ICT itself,
the scores do not show big differences between A, B and C
Four organisations participated in this study. They all had an - the participants in organisation D said that they only just
assessment team of 4 - 10 members who all filled out the ma- started and did not do much yet to apply energy and material
turity scan individually. The averages for each organisation efficient principles in their ICT equipment and use. Com-
on each attribute are shown in Table 3. mon practices amongst the participants were virtualisation
– 20 –