
Page 71 - Implementing ITU-T International Standards to Shape Smart Sustainable Cities: The Case of Dubai
P. 71
I: Core
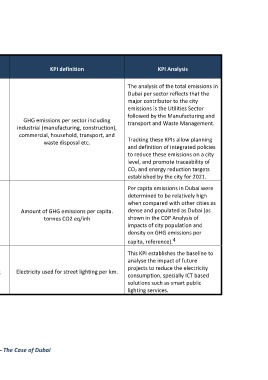
Sub-dimension KPI N Indicator KPI definition KPI Analysis
o
A: Additional
The analysis of the total emissions in
Dubai per sector reflects that the
major contributor to the city
emissions is the Utilities Sector
followed by the Manufacturing and
GHG emissions per sector including
transport and Waste Management.
GHG emissions per sector / industrial (manufacturing, construction),
D2.2 CO2 emissions A 221
per capita. commercial, household, transport, and
waste disposal etc. Tracking these KPIs allow planning
and definition of integrated policies
to reduce these emissions on a city
level, and promote traceability of
CO 2 and energy reduction targets
established by the city for 2021.
Per capita emissions in Dubai were
determined to be relatively high
when compared with other cities as
Amount of GHG emissions per capita. dense and populated as Dubai (as
D2.2 CO2 emissions I 221 GHG emissions
tonnes CO2 eq/inh shown in the CDP Analysis of
impacts of city population and
density on GHG emissions per
4
capita, reference).
This KPI establishes the baseline to
analyse the impact of future
projects to reduce the electricity
D2.3 Energy A 231 Electricity use for street lighting Electricity used for street lighting per km.
consumption, specially ICT based
solutions such as smart public
lighting services.
56 Implementing ITU-T International Standards to Shape Smart Sustainable Cities – The Case of Dubai