
Page 21 - Trends in Telecommunication Reform 2016
P. 21
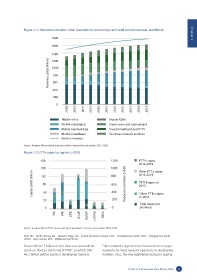
Figure 1.2: Telecommunication retail revenues by service type and total service revenue, worldwide


                                1800                                                                                Chapter 1
                                1600


                                1400
                              Revenue (USD billion)  1000
                                1200


                                 800
                                 600

                                 400

                                 200
                                   0
                                          2009  2010  2011  2012  2013  2014  2015  2016  2017  2018  2019


                                      Mobile voice                 Mobile M2M
                                      Mobile messaging             Fixed voice and narrowband
                                      Mobile handset data          Fixed broadband and IPTV
                                      Mobile broadband             Business network services
                                      Service revenue

               Source: Analysys Mason global telecoms market: interim forecast update 2014–2019
               Figure 1.3: FTTx capex by region to 2019


                         120                                        1200             FTTH capex
                                                                                     2014-2019
                          100                                       1000             Other FTTx capex
                     Capex (USD billion)  80                        600      Capex per premises (USD)  FTTH capex to
                                                                                     2014-2019
                                                                    800
                           60
                                                                                     2013
                                                                    400
                           40
                                                                                     to 2013
                           20                                        200             Other FTTx capex
                                                                                     Total capex per
                            0                                        0               premises
                                  NA   WE   CEE  DVAP  EMAP  LATAM  MEA


               Source: Analysys Mason FTTx roll-out and capex worldwide: forecasts and analysis 2014–2019

               Note: (NA = North America, WE = Western Europe, CEE = Central and Eastern Europe, DVAP = Developed Asia-Pacific, EMAP = Emerging Asia-Pacific,
               LATAM = Latin America, MEA = Middle and East Africa)

               Some USD 92.7 billion of this forescast total will be   Fibre networks appear to be favoured over copper
               spent on fibre to the home (FTTH) , of which USD   networks by fixed network operators in developing
                                            5
               46.2 billion will be spent in developing markets.   markets. Also, the low availability and poor quality


                                                                               Trends in Telecommunication Reform 2016  3