Page 16 - Verification Report Quito, Ecuador April 2025
P. 16

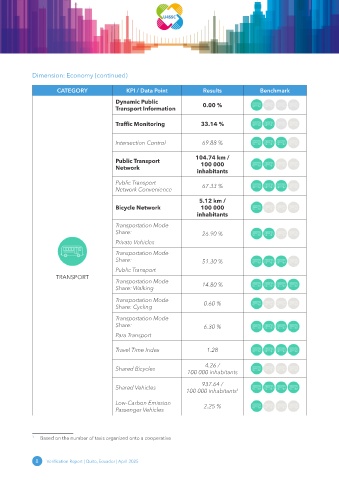
Dimension: Economy (continued)

                     CATEGORY                KPI / Data Point           Results             Benchmark

                                          Dynamic Public                0.00 %
                                          Transport Information

                                          Traffic Monitoring            33.14 %


                                          Intersection Control          69.88 %


                                                                      104.74 km /
                                          Public Transport              100 000
                                          Network
                                                                      inhabitants
                                          Public Transport              67.33 %
                                          Network Convenience
                                                                       5.12 km /
                                          Bicycle Network               100 000
                                                                      inhabitants

                                          Transportation Mode
                                          Share:                        26.90 %
                                          Private Vehicles

                                          Transportation Mode
                                          Share:                        51.30 %
                                          Public Transport
                     TRANSPORT
                                          Transportation Mode           14.80 %
                                          Share: Walking

                                          Transportation Mode            0.60 %
                                          Share: Cycling

                                          Transportation Mode
                                          Share:                         6.30 %

                                          Para Transport

                                          Travel Time Index               1.28

                                                                         4.26 /
                                          Shared Bicycles
                                                                   100 000 inhabitants

                                                                        937.64 /
                                          Shared Vehicles
                                                                  100 000 inhabitants 1
                                          Low-Carbon Emission            2.25 %
                                          Passenger Vehicles


            1   Based on the number of taxis organized onto a cooperative


              8  Verification Report | Quito, Ecuador | April 2025
   11   12   13   14   15   16   17   18   19   20   21