
Page 3 - U4SSC City Snapshot, Valencia, Spain, June 2020
P. 3
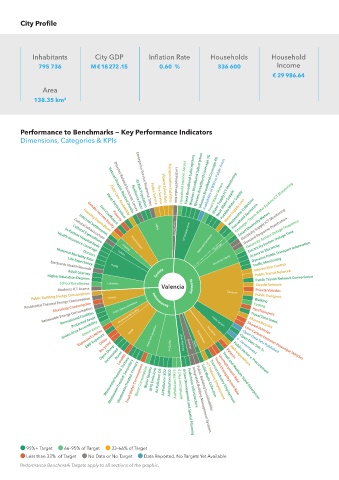
City Profile


             Inhabitants          City GDP           Inflation Rate        Households           Household
               795 736           M € 18 272 .15          0.60  %             336 600              Income
                                                                                                 € 29 986.64

                Area
             138.35 km  2


        Performance to Benchmarks — Key Performance Indicators
        Dimensions, Categories & KPIs


                                                                        Wireless Broadband Coverage 4G
                                                                 Household Internet Access Fixed Broadband Subscriptions Wireless Broadband Subscription Wireless Broadband Coverage 3G Availability of WIFI in Public Areas Potable Water Supply

                                                                            Water Supply ICT Monitoring
                                                                                    Drainage / Storm Water System ICT Monitoring
                                                                           Smart Water Meters
                                                                              Basic Water Supply
                                                                                  Wastewater Collection
                                                                                   Household Sanitation
                                                            Transportation Fatalities
                                                          Violent Crime Rate
                                                        Fire Service
                                                               Local Food Production
                                                      Police Service
                                                 Emergency Service Response Time
                                                 At Risk Population
                                               Resilience Plans
                                         Disaster Related Economic Losses
                                                                                     Smart Electricity Meters
                                       Natural Disaster Related Deaths
                                        Child Care Availability
                                                                                       Demand Response Penetration
                                      Voter Participation
                                                                                        Electricity System Outage Frequency
                                         Poverty
                                    Gini Coe cient
                                                                  ICT Infrastructure  Water Supply Loss Electricity Supply ICT Monitoring
                                Gender Income Equity
                              Housing Expenditure
                                                        Safety
                             Informal Settlements
                                                                       Water and Sanitation  Drainage  Electricity System Outage Time
                                                              Food Security
                           Cultural Infrastructure
                           Cultural Expenditure
                                                                                          Dynamic Public Transport Information
                                                                                         Access to Electricity
                        In-Patient Hospital Beds
                                               Social Inclusion
                     Health Insurance Coverage
                                            Housing
                              Doctors
                                          Culture
                                                                            Electricity Supply  Tra c Monitoring
                     Maternal Mortality Rate
                         Life Expectancy
                   Electronic Health Records
                                                                                           Public Transit Network
                         Adult Literacy  Health                                           Intersection Control
                  Higher Education Degrees                                                 Public Transit Network Convenience
                      School Enrollment  Education                                     Environment                      Society   Bicycle Network
                                                          Valencia
                     Students ICT Access                  V alencia  Economy               Private Vehicles
            Public Building Energy Consumption  Energy                           Transport  Public Transport
          Residential Thermal Energy Consumption  Public Space and Nature                 Cycling
                                                                                          Walking
                    Electricity Consumption
                Renewable Energy Consumption  Environmental Quality        Public Service  Shared Bicycles
                      Recreational Facilities
                                                                                          ParaTransport
                          Protected Areas
                       Green Area Accessibility  Waste  Water and Sanitation  Employment  Innovation  Shared Vehicles
                                                                                         Travel Time Index
                              Green Areas
                            ExposureTo Noise
                               EMF Exposure
                                     Other
                                    Recycled
                                     Open Dump  Burnt Land ll  Air Quality  Urban Planning  Buildings  Waste  Patents  e- Government
                                      Incinerated
                                                                                     Open Data Sets %
                                                                                      Open Data Sets Published
                                      WastewaterTreated: Tertiary Fresh Water Consumption Water Consumption Water Quality GHG Emissions  AirPollution O3  AirPollution SO2  AirPollution NO2  AirPollution PM10  Pedestrian Infrastructure  Solid Waste Collection  Unemployment Rate
                                                                                       Low-Carbon Emission Passenger Vehicles
                                        WastewaterTreated: Secondary
                                           WastewaterTreated: Primary
                                                                                  R&D expenditure
                                                                                   Public Sector e-Procurement
                                                                            Youth Unemployment Rate
                                                                               Small and Medium-Sized Enterprises
                                                                         ICT Industry Employment
                                                                           Tourism Industry Employment
                                                                      Public Building Sustainability
                                                                     Integrated Building Management Systems
           95%+ Target        66–95% of Target        33–66% of Target  AirPollution PM2.5 Urban Development and Spatial Planning
           Less than 33%  of Target        No Data or No Target        Data Reported, No Targets Yet Available
        Performance Benchmark Targets apply to all sections of the graphic.