
Page 247 - ITU Kaleidoscope 2016
P. 247
ICTs for a Sustainable World
information, however this paper aims to make a first draft Big Sensor Data server to further develop studies and
standard in structuring data sent by the measurement nodes, establish hypothesis.
at level information analysis.
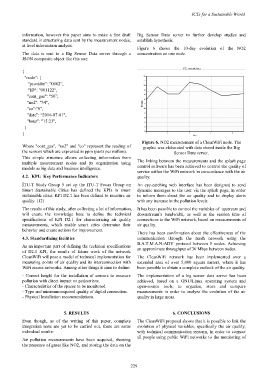
Figure 6 shows the 10-day evolution of the NO2
The data is sent to a Big Sensor Data server through a concentration on one node.
JSON composite object like this one:
{
"node": {
“provider”: “0002”,
"ID": "001122",
"cont_gas": “50”,
"no2": "34",
"co":"0",
"date": “2016-07-01",
"hour": "15:23",
}
}
Figure 6. NO2 measurement of a CleanWiFi node. The
Where "cont_gas", "no2" and "co" represent the reading of graphic was elaborated with data stored inside the Big
the sensors which are expressed in ppm (parts per million). Sensor Data server.
This simple structure allows collecting information from
multiple measurement nodes and its organization using The linking between the measurements and the splash page
models as big data and business intelligence. control software has been achieved to control the quality of
service within the WiFi network in concordance with the air
4.2. KPI: Key Performance Indicators quality.
ITU-T Study Group 5 set up the ITU-T Focus Group on An eye-catching web interface has been designed to send
Smart Sustainable Cities has defined the KPIs in smart dynamic messages to the user via the splash page, in order
sustainable cities. KPI D2.1 has been defined to measure air to inform them about the air quality and to display alerts
quality. [12] with any increase in the pollution levels.
The results of this study, after collecting a lot of information, It has been possible to control the variables of upstream and
will create the knowledge base to define the technical downstream’s bandwidth, as well as the session time of
specifications of KPI D2.1 for characterizing air quality connections to the WiFi network, based on measurements of
measurements, which enable smart cities determine their air quality.
behavior and create actions for improvement.
There has been confirmation about the effectiveness of the
4.3. Standardizing facilities communication through the mesh network using the
B.A.T.M.A.N-ADV protocol between 5 nodes. Achieving
As an important part of defining the technical specifications an approximate throughput of 30 Mbps between nodes.
of D2.1 KPI, the results of future work of the network
CleanWiFi will pose a model of technical implementation for The CleanWiFi network has been implemented over a
measuring points of air quality and its interconnection with extended area of over 5,000 square meters, where it has
WiFi access networks. Among other things it aims to define: been possible to obtain a complete outlook of the air quality.
- Correct height for the installation of sensors to measure The implementation of a big sensor data server has been
pollution with direct impact on pedestrians. achieved, based on a GNU/Linux operating system and
- Characteristics of the spaces to be monitored. open-source tools, to organize, store and compare
- Type and minimum required quality of digital connection. measurements in order to analyze the evolution of the air
- Physical Installation recommendations. quality in large areas.
5. RESULTS 6. CONCLUSIONS
Even though, as of the writing of this paper, complete The CleanWiFi proposal shows that it is possible to link the
integration tests are yet to be carried out, there are some evolution of physical variables, specifically the air quality,
individual results: with technical communication systems, in order to connect
all people using public WiFi networks to the monitoring of
Air pollution measurements have been acquired, showing
the presence of gases like NO2, and storing the data on the
– 229 –