
Page 217 - ITU Kaleidoscope 2016
P. 217
ICTs for a Sustainable World
0.98 40
0.96
35
0.94
30
0.92 25
0.9
SSIM 0.88 ABBA A-PSNR (dB) 20 ABBA
0.86 HDR 15 FDR
0.84 BSR 10
0.82 5 BSR
0.8
0
1 2 3 4 5 6 7 8 9 10
1 2 3 4 5 6 7 8 9 10
FRAME #
FRAME #
Figure 5. The SSIM index
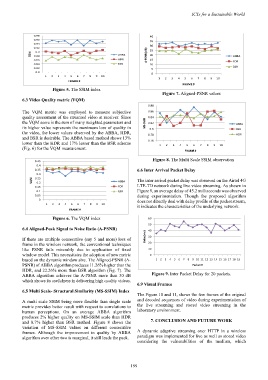
Figure 7. Aligned-PSNR values
6.3 Video Quality metric (VQM)
0.88
The VQM metric was employed to measure subjective 0.86
quality assessment of the streamed video at receiver. Since 0.84
the VQM score is the sum of many weighted parameters and MS-SSIM 0.82 ABBA
its higher value represents the maximum loss of quality in 0.8 BSR
the video, the lower values observed by the ABBA, HDR, 0.78 HDR
and BSR is desirable. The ABBA based method shows 13%
lower than the HDR and 17% lesser than the BSR scheme 0.76 1 2 3 4 5 6 7 8 9 10
(Fig. 6) for the VQM measurement.
FRAME #
Figure 8. The Multi Scale SSIM observation
0.45
0.4
0.35 6.6 Inter Arrival Packet Delay
0.3
VQM 0.25 ABBA The inter arrival packet delay was observed on the Airtel 4G
0.2
0.15 FDR LTE-TD network during live video streaming. As shown in
0.1 BSR Figure 9, an average delay of 45.2 milliseconds was observed
0.05 during experimentation. Though the proposed algorithm
does not directly deal with delay profile of the packet stream,
0
1 2 3 4 5 6 7 8 9 10
it indicates the characteristics of the underlying network.
FRAME #
Figure 6. The VQM index 60
50
6.4 Aligned-Peak Signal to Noise Ratio (A-PSNR) 40
If there are multiple consecutive (say 5 and more) loss of Delay (ms) 30
frame in the wireless network, the conventional techniques 20
like PSNR fails miserably due to application of fixed 10
window model. This necessitates the adoption of new metric 0
based on the dynamic window size. The Aligned-PSNR (A- 123456 789 10 11 12 13 14 15 16 17 18 19
PSNR) of ABBA algorithm produces 11.26% higher than the Packet #
HDR, and 22.26% more than BSR algorithm (Fig. 7). The
ABBA algorithm achieves the A-PSNR more than 30 dB Figure 9. Inter Packet Delay for 20 packets.
which shows its usefulness in delivering high quality videos.
6.9 Visual Frames
6.5 Multi Scale- Structural Similarity (MS-SSIM) Index
The Figure 10 and 11, shows the few frames of the original
A multi scale SSIM being more flexible than single scale and decoded sequences of video during experimentation of
metric provides better result with respect to correlations to the live streaming and stored video streaming in the
human perceptions. On an average ABBA algorithm laboratory environment.
produces 2% higher quality on MS-SSIM scale than HDR
and 0.7% higher than BSR method. Figure 8 shows the 7. CONCLUSION AND FUTURE WORK
variation of MS-SSIM values on different consecutive
frames. Although the improvement in quality by ABBA A dynamic adaptive streaming over HTTP in a wireless
algorithm over other two is marginal, it still leads the pack. paradigm was implemented for live as well as stored video
considering the vulnerabilities of the medium, which
– 199 –