
Page 9 - U4SSC Snapshot, Møre og Romsdal, Norway, November 2021
P. 9
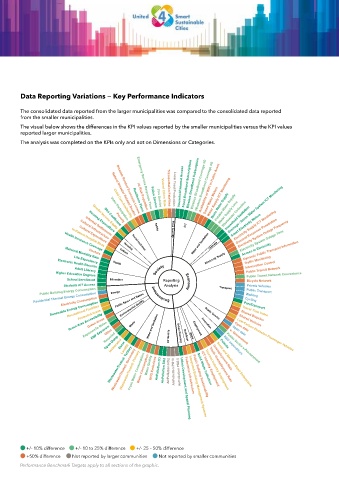
Data Reporting Variations — Key Performance Indicators
Foreword
The consolidated data reported from the larger municipalities was compared to the consolidated data reported
from the smaller municipalities.
This publication has been developed by ITU within the framework
The visual below shows the differences in the KPI values reported by the smaller municipalities versus the KPI values
of the United for Smart Sustainable Cities (U4SSC) initiative. It
reported larger municipalities.
provides a visual overview on a city’s performance to benchmark
The analysis was completed on the KPIs only and not on Dimensions or Categories.
in the Key Performance Indicators for Smart Sustainable Cities.
The visual representation highlights a city’s performance in each
Wireless Broadband Subscription
Fixed Broadband Subscriptions
Wireless Broadband Coverage 3G
dimension and subdimension of the KPIs for SSC based on the
Wireless Broadband Coverage 4G
Availability of WIFI in Public Areas
Household Internet Access
inherited benchmark value of each indicator. This set of KPIs for
SSC was developed to establish the criteria to evaluate ICTs’
Water Supply ICT Monitoring
contributions in making cities smarter and more sustainable, and
Potable Water Supply
to provide cities with the means for self-assessments. Smart Water Meters Basic Water Supply Drainage / Storm Water System ICT Monitoring
Wastewater Collection
Household Sanitation
Transportation Fatalities
Local Food Production
Violent Crime Rate
Fire Service
Police Service
Emergency Service Response Time
At Risk Population
Resilience Plans
Smart Electricity Meters
Disaster Related Economic Losses
Natural Disaster Related Deaths
Child Care Availability
Voter Participation
Electricity System Outage Frequency
Poverty
ICT Water Supply Loss Electricity Supply ICT Monitoring
Gini Coefficient
Gender Income Equity
Disclaimer Cultural Expenditure Food Security Demand Response Penetration
Housing Expenditure
Safety
Water and Sanitation
Informal Settlements
Cultural Infrastructure
Dynamic Public Transport Information
The views expressed in this publication are those of the authors Electricity System Outage Time
Drainage
In-Patient Hospital Beds
Housing
Health Insurance Coverage
and do not necessarily reflect the views of the contributing Access to Electricity
Social Inclusion
Culture
Doctors
Maternal Mortality Rate
organizations. Life Expectancy Health Electricity Supply Traffic Monitoring
Intersection Control
Electronic Health Records
Adult Literacy Economy Environment Society Public Transit Network
Any references made to specific countries, companies, products, Public Transit Network Convenience
Higher Education Degrees
School Enrollment
Education
Bicycle Network
Reporting
initiatives, policies, framework or guidelines do not in any way Private Vehicles
Students ICT Access
Analysis
Public Building Energy Consumption
Transport
imply that they are endorsed or recommended by ITU, the Walking
Public Transport
Energy
Residential Thermal Energy Consumption
Public Space and Nature
Electricity Consumption
authors, or any other organization that the authors are affiliated Cycling
Environmental Quality
Renewable Energy Consumption
Recreational Facilities
with, in preference to others of similar nature that are not Public Service Travel Time Index
ParaTransport
Protected Areas
Water and Sanitation
mentioned. Green Area Accessibility Waste Innovation Shared Vehicles
Green Areas
Shared Bicycles
ExposureTo Noise
EMF Exposure
Other
This publication is intended for informational purposes only. The Open data
Open data
Air Quality
Recycled
Open Dump
Employment
results and interim findings presented are a work in progress, as e- Government
Incinerated
Waste
Burnt
Buildings
Urban Planning
Landfill
the KPIs (Recommendation ITU-T Y.4903/L.1603) implemented in
WastewaterTreated: Tertiary
Patents
WastewaterTreated: Secondary
Low-Carbon Emission Passenger Vehicles
WastewaterTreated: Primary
Fresh Water Consumption
R&D expenditure
Water Consumption
the city during the first phase of the project are being refined to
Water Quality
GHG Emissions
AirPollution O3
AirPollution SO2
AirPollution PM10
AirPollution NO2
Public Sector e-Procurement
improve the applicability of these KPIs to all cities. The revision
Unemployment Rate
of the KPIs may alter their scope and definition as well as the
required data collection process. Integrated Building Management Systems
Youth Unemployment Rate
Solid Waste Collection
Small and Medium-Sized Enterprises
ICT Industry Employment
Tourism Industry Employment
© ITU – All rights reserved. Requests to reproduce extracts of this
Pedestrian Infrastructure
Public Building Sustainability
publication may be submitted to jur@itu.int. AirPollution PM2.5 Urban Development and Spatial Planning
+/- 10% difference
+/- 10% difference +/- 10 to 25% difference +/- 25 – 50% difference +/- 10 to 25 % difference
+/- 25 – 50% difference
+50% difference Not reported by larger communities Not reported by smaller communities +50% difference
Not reported by smaller communities
Performance Benchmark Targets apply to all sections of the graphic. Not reported by larger communities