
Page 37 - ITU Journal Future and evolving technologies Volume 2 (2021), Issue 7 – Terahertz communications
P. 37
ITU Journal on Future and Evolving Technologies, Volume 2 (2021), Issue 7
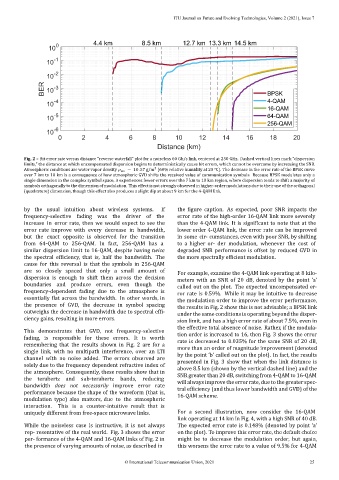
Fig. 2 – Bit error rate versus distance “reverse waterfall” plot for a noiseless 60 Gb/s link, centered at 250 GHz. Dashed vertical lines mark “dispersion
limits,” the distance at which uncompensated dispersion begins to deterministically cause bit errors, which cannot be overcome by increasing the SNR.
3
Atmospheric conditions are water vapor density wv = 10.37 g/m (60% relative humidity at 20 °C). The decrease in the error rate of the BPSK curve
over 7 km to 10 km is a consequence of how atmospheric GVD shifts the received value of communication symbols. Because BPSK modulates only a
single dimension in the complex symbol space, it experiences fewer errors over the 7 km to 10 km region, where dispersion tends to shift a majority of
symbols orthagonally to the dimension of modulation. This effect is not strongly observed in higher‑order modulations due to their use of the orthagonal
(quadrature) dimension, though this effect also produces a slight dip at about 9 km for the 4‑QAM link.
usual intuition about wireless systems. If the igure caption. As expected, poor SNR impacts the
frequency‑selective fading was the driver of the error rate of the high‑order 16‑QAM link more severely
increase in error rate, then we would expect to see the than the 4‑QAM link. It is signi icant to note that at the
error rate improve with every decrease in bandwidth, lower order 4‑QAM link, the error rate can be improved
but the exact opposite is observed for the transition in some cir‑ cumstances, even with poor SNR, by shifting
from 64‑QAM to 256‑QAM. In fact, 256‑QAM has a to a higher or‑ der modulation, whenever the cost of
similar dispersion limit to 16‑QAM, despite having twice degraded SNR performance is offset by reduced GVD in
the spectral ef iciency, that is, half the bandwidth. The the more spectrally ef icient modulation.
cause for this reversal is that the symbols in 256‑QAM
are so closely spaced that only a small amount of
For example, examine the 4‑QAM link operating at 8 kilo‑
dispersion is enough to shift them across the decision
meters with an SNR of 20 dB, denoted by the point ‘a’
boundaries and produce errors, even though the
called out on the plot. The expected uncompensated er‑
frequency‑dependent fading due to the atmosphere is
ror rate is 0.59%. While it may be intuitive to decrease
essentially lat across the bandwidth. In other words, in
the modulation order to improve the error performance,
the presence of GVD, the decrease in symbol spacing
the results in Fig. 2 show this is not advisable; a BPSK link
outweighs the decrease in bandwidth due to spectral ef i‑ under the same conditions is operating beyond the disper‑
ciency gains, resulting in more errors.
sion limit, and has a high error rate of about 7.5%, even in
the effective total absence of noise. Rather, if the modula‑
This demonstrates that GVD, not frequency‑selective
tion order is increased to 16, then Fig. 3 shows the error
fading, is responsible for these errors. It is worth
rate is decreased to 0.035% for the same SNR of 20 dB,
remembering that the results shown in Fig. 2 are for a
more than an order of magnitude improvement (denoted
single link, with no multipath interference, over an L TI
by the point ‘b’ called out on the plot). In fact, the results
channel with no noise added. The errors observed are
presented in Fig. 3 show that when the link distance is
solely due to the frequency dependent refractive index of
above 8.5 km (shown by the vertical dashed line) and the
the atmosphere. Consequently, these results show that in
SNR greater than 20 dB, switching from 4‑QAM to 16‑QAM
the terahertz and sub‑terahertz bands, reducing
will always improve the error rate, due to the greater spec‑
bandwidth does not necessarily improve error rate
tral ef iciency (and thus lower bandwidth and GVD) of the
performance because the shape of the waveform (that is,
16‑QAM scheme.
modulation type) also matters, due to the atmospheric
interaction. This is a counter‑intuitive result that is
uniquely different from free‑space microwave links. For a second illustration, now consider the 16‑QAM
link operating at 14 km in Fig. 4, with a high SNR of 40 dB.
While the noiseless case is instructive, it is not always The expected error rate is 0.148% (denoted by point ‘a’
rep‑ resentative of the real world. Fig. 3 shows the error on the plot). To improve this error rate, the default choice
per‑ formance of the 4‑QAM and 16‑QAM links of Fig. 2 in might be to decrease the modulation order, but again,
the presence of varying amounts of noise, as described in this worsens the error rate to a value of 9.5% for 4-QAM
© International Telecommunication Union, 2021 25