
Page 65 - ITU Journal Future and evolving technologies Volume 2 (2021), Issue 1
P. 65
ITU Journal on Future and Evolving Technologies, Volume 2 (2021), Issue 1
to place SDN controllers, this study proposes the use of • The bandwidth for all connection links is constant;
a classical machine learning algorithm called Partition
Around Medoids (PAM) [28]. To determine the optimal • Control path security and reliability has been
number of controllers to deploy given a wide area perfectly solved;
network, this study proposes the use of Silhouette [29]
and Gap Statistics [30] algorithms. To mimic a real SDN • Controllers are co‑located with some of the switches;
deployment, the controller placement problem is studied • Switches incur a ixed load.
using an emulation orchestration platform. This is
something that to the best of our knowledge has not been 4.2 Optimal number of controllers
done, and we consider it necessary to verify the outcome
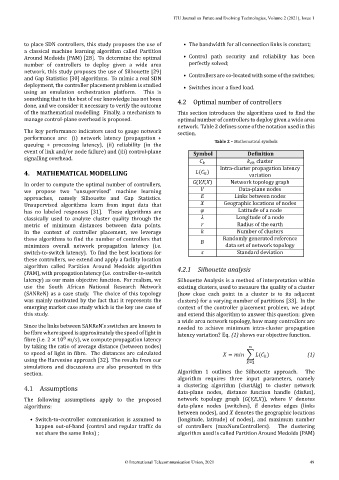
of the mathematical modelling. Finally, a mechanism to This section introduces the algorithms used to ind the
manage control‑plane overhead is proposed. optimal number of controllers to deploy given a wide area
network. Table 2 de ines some of the notation used in this
The key performance indicators used to gauge network section.
performance are: (i) network latency (propagation +
queuing + processing latency), (ii) reliability (in the Table 2 – Mathematical symbols
event of link and/or node failure) and (iii) control‑plane Symbol De inition
signalling overhead.
ℎ cluster
Intra‑cluster propagation latency
4. MATHEMATICAL MODELLING ( ) variation
G(V,E,X) Network topology graph
In order to compute the optimal number of controllers,
we propose two ”unsupervised” machine learning V Data‑plane nodes
approaches, namely Silhouette and Gap Statistics. E Links between nodes
Unsupervised algorithms learn from input data that X Geographic locations of nodes
has no labeled responses [31]. These algorithms are Latitude of a node
classically used to analyze cluster quality through the Longitude of a node
metric of minimum distances between data points. Radius of the earth
In the context of controller placement, we leverage Number of clusters
these algorithms to ind the number of controllers that Randomly generated reference
minimizes overall network propagation latency (i.e. data set of network topology
switch‑to‑switch latency). To ind the best locations for Standard deviation
these controllers, we extend and apply a facility location
algorithm called Partition Around Medoids algorithm 4.2.1 Silhouette analysis
(PAM), with propagation latency (i.e. controller‑to‑switch
latency) as our main objective function. For realism, we Silhouette Analysis is a method of interpretation within
use the South African National Research Network existing clusters, used to measure the quality of a cluster
(SANReN) as a case study. The choice of this topology (how close each point in a cluster is to its adjacent
was mainly motivated by the fact that it represents the clusters) for a varying number of partitions [33]. In the
emerging market case study which is the key use case of context of the controller placement problem, we adopt
this study. and extend this algorithm to answer this question: given
a wide area network topology, how many controllers are
Since the links between SANReN’s switches are known to needed to achieve minimum intra‑cluster propagation
be ibre where speed is approximately the speed of light in latency variation? Eq. (1) shows our objective function.
8
ibre (i.e. 2 × 10 / ), we compute propagation latency
by taking the ratio of average distance (between nodes)
to speed of light in ibre. The distances are calculated = ( ) (1)
using the Harvesine approach [32]. The results from our
=2
simulations and discussions are also presented in this
section. Algorithm 1 outlines the Silhouette approach. The
algorithm requires three input parameters, namely
a clustering algorithm (clustAlg) to cluster network
4.1 Assumptions
data‑plane nodes, distance function handle (disfun),
The following assumptions apply to the proposed network topology graph (G(V,E,X)), where V denotes
algorithms: data‑plane nodes (switches), E denotes edges (links
between nodes), and X denotes the geographic locations
• Switch‑to‑controller communication is assumed to (longitude, latitude) of nodes), and maximum number
happen out‑of‑band (control and regular traf ic do of controllers (maxNumControllers). The clustering
not share the same links) ; algorithm used is called Partition Around Medoids (PAM)
© International Telecommunication Union, 2021 49