
Page 35 - U4SSC Factsheet Ålesund, Norway, June 2020
P. 35
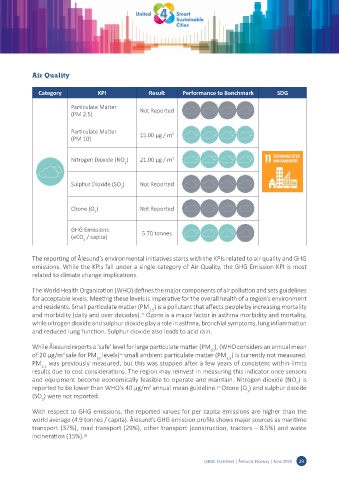
Air Quality

               Category            KPI               Result      Performance to Benchmark         SDG


                          Particulate Matter      Not Reported
                          (PM 2.5)


                          Particulate Matter      15.00 µg / m 3
                          (PM 10)


                          Nitrogen Dioxide (NO )  21.00 µg / m 3
                                             2


                          Sulphur Dioxide (SO )   Not Reported
                                           2


                          Ozone (O )              Not Reported
                                  3


                          GHG Emissions
                          (eCO  / capita)          5.70 tonnes
                              2


            The reporting of Ålesund’s environmental initiatives starts with the KPIs related to air quality and GHG
            emissions. While the KPIs fall under a single category of Air Quality, the GHG Emission KPI is most
            related to climate change implications.


            The World Health Organization (WHO) defines the major components of air pollution and sets guidelines
            for acceptable levels. Meeting these levels is imperative for the overall health of a region’s environment
            and residents. Small particulate matter (PM ) is a pollutant that affects people by increasing mortality
                                                     2.5
            and morbidity (daily and over decades).  Ozone is a major factor in asthma morbidity and mortality,
                                                   25
            while nitrogen dioxide and sulphur dioxide play a role in asthma, bronchial symptoms, lung inflammation
            and reduced lung function. Sulphur dioxide also leads to acid rain.

            While Ålesund reports a ‘safe’ level for large particulate matter (PM ), (WHO considers an annual mean
                                                                           10
            of 20 μg/m safe for PM  levels)  small ambient particulate matter (PM ) is currently not measured.
                       3
                                           26
                                                                                 2.5
                                   10
            PM  was previously measured, but this was stopped after a few years of consistent within-limits
                2.5
            results due to cost considerations. The region may reinvest in measuring this indicator once sensors
            and equipment become economically feasible to operate and maintain. Nitrogen dioxide (NO ) is
                                                                                                         2
            reported to be lower than WHO's 40 μg/m  annual mean guideline.  Ozone (O ) and sulphur dioxide
                                                     3
                                                                             27
                                                                                        3
            (SO ) were not reported.
                2
            With respect to GHG emissions, the reported values for per capita emissions are higher than the
            world average (4.9 tonnes / capita). Ålesund’s GHG emission profile shows major sources as maritime
            transport (37%), road transport (29%), other transport (construction, tractors – 8.5%) and waste
            incineration (15%). 28


                                                                         U4SSC Factsheet | Ålesund, Norway | June 2020  29