
Page 24 - U4SSC Factsheet Ålesund, Norway, June 2020
P. 24
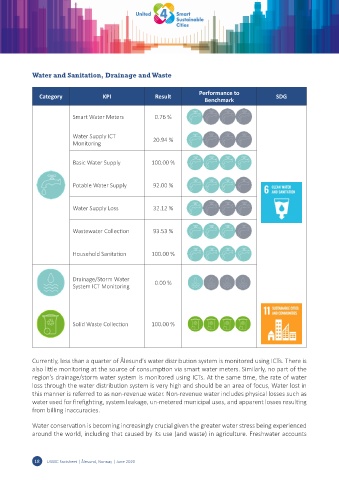
Water and Sanitation, Drainage and Waste

                                                                       Performance to
               Category              KPI                Result                                    SDG
                                                                         Benchmark


                           Smart Water Meters          0.76 %


                           Water Supply ICT
                           Monitoring                  20.94 %


                           Basic Water Supply         100.00 %


                           Potable Water Supply        92.00 %


                           Water Supply Loss           32.12 %


                           Wastewater Collection       93.53 %


                           Household Sanitation       100.00 %


                           Drainage/Storm Water        0.00 %
                           System ICT Monitoring


                           Solid Waste Collection     100.00 %


            Currently, less than a quarter of Ålesund's water distribution system is monitored using ICTs. There is
            also little monitoring at the source of consumption via smart water meters. Similarly, no part of the
            region’s drainage/storm water system is monitored using ICTs. At the same time, the rate of water
            loss through the water distribution system is very high and should be an area of focus, Water lost in
            this manner is referred to as non-revenue water. Non-revenue water includes physical losses such as
            water used for firefighting, system leakage, un-metered municipal uses, and apparent losses resulting
            from billing inaccuracies.

            Water conservation is becoming increasingly crucial given the greater water stress being experienced
            around the world, including that caused by its use (and waste) in agriculture. Freshwater accounts


             18  U4SSC Factsheet | Ålesund, Norway | June 2020