
Page 38 - Methodology for inter-operator and cross-border P2P money transfers
P. 38
Please note: The exact way of how to run the join The third and final step of processing is then creating
operations will also depend on the way the measure- respective table and graphical visualizations. Typical-
ments are done. If devices are kept within the same ly, this is made by either creating tables in a spread-
team, and different configurations are used, the sheet application such as Excel® for conversion to
device/app ID has to be linked to the Owner Team graphics, or directly using graphical front-end tools.
(see Team Assignment List (TAL) and Device Assign-
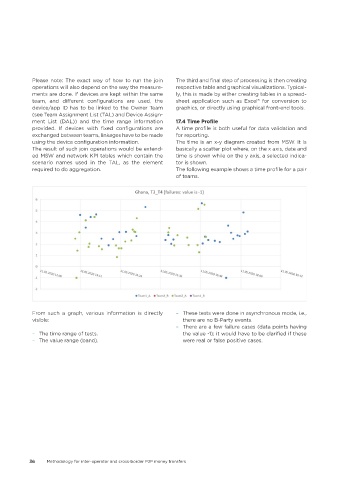
ment List (DAL)) and the time range information 17�4 Time Profile
provided. If devices with fixed configurations are A time profile is both useful for data validation and
exchanged between teams, linkages have to be made for reporting.
using the device configuration information. The time is an x-y diagram created from MSW. It is
The result of such join operations would be extend- basically a scatter plot where, on the x axis, date and
ed MSW and network KPI tables which contain the time is shown while on the y axis, a selected indica-
scenario names used in the TAL, as the element tor is shown.
required to do aggregation. The following example shows a time profile for a pair
of teams.
From such a graph, various information is directly – These tests were done in asynchronous mode, i.e.,
visible: there are no B-Party events.
– There are a few failure cases (data points having
– The time range of tests. the value -1); it would have to be clarified if these
– The value range (band). were real or false positive cases.
36 Methodology for inter-operator and cross-border P2P money transfers