
Page 78 - Proceedings of the 2018 ITU Kaleidoscope
P. 78
2018 ITU Kaleidoscope Academic Conference
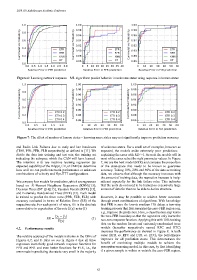
Figure 6: Learning network response – ML algorithms predict behavior in unknown states using response in known states
Figure 7: The effect of number of known states – knowing more states may not significantly improve prediction accuracy
and Radio Link Failures due to early and late handovers of unknown states. For a small set of examples, however as
(HOS, PPR, FER, FLR respectively) as defined in [11]. We expected, the models make extremely poor predictions –
divide the data into training and test sets, the training set explaining the cases with RE>>1. As such the models will in
indicating the subspace which the CAN will have learned. most of the cases select the right parameter values. In Figure
The intention is to use machine learning regression (an 7, we use the best model (ETR) and compare the proportion
expected capability of the DApps, CE, or CME) to determine of the state-space that needs to be known to guarantee
how well we can predict network performance at unknown accuracy. Taking 10%, 20% and 40% of the data as training
combinations of velocity and Hys-TTT configurations. data, we observe that although the accuracy increases with
the amount of training data, the respective increase is insig-
We compare four models for prediction, which are regressors nificant especially for the link failure rates. This indicates
based on -Nearest Neighbors Regression (KNN) [13]; that the units do not need to be trained on excessively large
Decision Trees (DT )[14][15], Random Forests (RFR) [15], amount of data for them to be able to derive structure.
and Extremely Randomized Trees (ETR) [15]. Each model
is trained to predict the three rates (PPR, FER, FLR) with However, it may be possible to achieve better outcomes
accuracy evaluated in terms of Relative Error (RE) of the through smart combinations of algorithms. With knowledge
respective rate. For each point i of rate y, RE is the absolute that FER is zero for low to medium HO delay, a two-step
error relative to expectation of the rate E{y} as in (1) learning process that first separates the zero-FER region can,
e.g., improve the prediction. Here, a classification step learns
| the zero-FER boundary so that the regression only learns the
|
1
non-zero response function. Applying this with 10% training
data on the random forests and extremely randomized trees
4.2. Performance results models (hereafter respectively named RFC and ETC)
improves the performance as showed in Figure 8. In both
The relative accuracy of the models is shown in the CDFs of cases (RFR vs. RFC and ETR vs. ETC), the performance
Figures 6,7, and 8. First we see in Figure 6 that all three improves for all prediction states. This demonstrates the
regressors learn fairly good network response functions for benefit of combining multiple models to achieve the
PPR and FER and even better functions for FLR, i.e., the perception-reasoning model. In this case, by first identifying
error made in predicting the rate is very small in the majority if a given sample is within or outside the zero-FER region,
– 62 –