
Page 70 - Proceedings of the 2018 ITU Kaleidoscope
P. 70
2018 ITU Kaleidoscope Academic Conference
represents the multifractal spectrum with a lousy sampling Multifractal modelling of spectral occupancy data in mobile
procedure, leading to an unmanageable calculation of the networks can become an excellent prediction tool of the
multifractal spectrum’s width. primary user’s behavior. Hence, spectral resources can be
used more efficiently and improve the design of CR
networks. Although Wi-Fi is freely accessed, it can be
considered as an alternative for spectral resource allocation.
ACKNOWLEDGMENTS
The authors wish to thank Center for Research and Scientific
Development of Universidad Distrital Francisco José de
Caldas for the supporting and funding during the course of
this research project.
REFERENCES
Figure 8 – Before and after optimal sampling [1] L. F. Pedraza, C. Hernández, K. Galeano, E.
a. MD b. MS Rodríguez-Colina, and I. P. Páez, Ocupación
espectral y modelo de radio cognitiva para Bogotá,
By correcting the MD sampling, the yellow curve in Figure Primera. Bogotá: Editorial UD, 2016.
8a is obtained. It decreases when q goes from the negative to
the positive domain. Plus, the calculation of the MS width [2] L. Pedraza, C. Hernandez, and E. Rodriguez,
becomes more precise as shown in Figure 8b. “Modeling of GSM Spectrum Based on Seasonal
ARIMA model,” in The 6th IEEE Latin-American
4.3 Multifractal spectrum calculation for the Conference on Communications, 2014.
radioelectric spectrum of Bogotá
[3] T. M. Roberson, R. B. Taher, K. J. Bacchus, and D.
Once the MDs are corrected, all the spectral widths are A. Zdunek, “Long-term spectral occupancy findings
computed in order to verify the multifractality of the time in Chicago,” in New Frontiers in Dynamic Spectrum
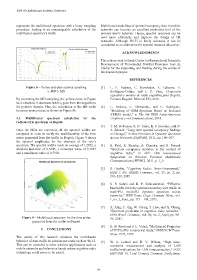
series generated from the traffic in Bogotá. Figure 9 shows Access Networks (DySPAN), 2011, pp. 100–107.
the spectral amplitudes for the channels of the city’s
spectrum. The spectral widths reach an average of 1.2072, a [4] K. Patil, K. Skouby, A. Chandra, and R. Prasad,
standard deviation of 0.3647, a minimum value of 0.7285 “Spectrum occupancy statistics in the context of
and a maximum value of 4.7910. cognitive radio,” in 2011 14th International
Symposium on Wireless Personal Multimedia
Communications (WPMC), 2011, p. 1_5.
[5] S. Haykin, “Cognitive Radio : Brain-Empowered,”
IEEE J. Sel. AREAS Commun., vol. 23, no. 2, pp.
201–220, 2005.
[6] S. E. Safavi and K. P. Subbalakshmi, “Effective
bandwidth for delay tolerant secondary user traffic in
multi-PU, multi-SU dynamic spectrum access
networks,” IEEE Trans. Cogn. Commun. Netw., vol.
1, no. 2, June., pp. 175 – 184, 2015.
[7] X. Xing, T. Jing, W. Cheng, Y. Huo, and X. Cheng,
“Spectrum prediction in cognitive radio networks,”
IEEE Wirel. Commun., vol. 20, no. 2, April, pp. 90–
Figure 9 – Multifractal spectrum for the time series 96, 2013.
generated from the traffic in Bogotá
[8] R. H. Riedi and J. L. Vehel, “Multifractal Properties
5. CONCLUSIONS of TCP traffic: a numerical study,” IEEE/ACM Trans.
Netw. 1997, 1997.
The results of this research evidence the multifractal
behavior of data traffic in wireless networks such as Wi-Fi. [9] W. E. Leland and D. V. Wilson, “High time-
This can be extended to other wireless applications such as resolution measurement and analysis of LAN
mobile networks and television bands, where cognitive radio
traffic:Implications for LAN interconnection,” IEEE
technology could prove to be useful. INFCOM ’91. Conf. Comput. Commun. Tenth Annu.
– 54 –