
Page 135 - Proceedings of the 2018 ITU Kaleidoscope
P. 135
Machine learning for a 5G future
3. EXPERIMENTAL RESULTS 4.2.1. Threshold of Acceptance
Performance of the proposed work is analyzed by During nearest neighbor search, the threshold of acceptance
experimenting with two major public datasets namely, plays an important role in classifying a block in a frame for
UMN and UCSD [19] datasets and also a created dataset in the normal/abnormal identification. Larger threshold means
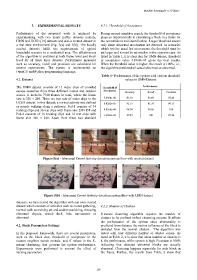
a real time environment (Fig. 5(a) and 5(b)). The locally only sharp abnormal movements are detected. In scenarios
created datasets fulfill the requirements of typical which involve usual fast movements, the threshold must be
household scenario in a residential area. The effectiveness set larger and it must be set smaller in the opposite case. As
of the algorithm is analyzed at both frame level and block listed in Table 1, it is clear that for UMN dataset, threshold
level for all these three datasets. Performance measures of acceptance value 4.8368e-04 gives the best results.
such as accuracy, recall and precision are calculated for When the threshold value is higher, the recall is 100%, i.e.,
several experiments. The system is implemented on the algorithm predicted all actual abnormal as abnormal.
OpenCV and Python programming language.
Table 1– Performance of the system with various threshold
4.1. Dataset values in UMN Dataset
The UMN dataset consists of 11 video clips of crowded Threshold of Performance
escape scenarios from three different indoor and outdoor Acceptance Accuracy Recall Precision
scenes. It includes 7740 frames in total, where the frame
size is 320 × 240. There are two sets of video clips in the 5.8368e-06 82.10 83.69 97.46
UCSD dataset. In this dataset, a normal activity was defined 8.8292e-05 91.57 91.76 98.73
as people walking along a pathway. Ped-1 consists of 34
training clips and 36 test clips with frame size 238×158 and 4.8368e-04 98.94 98.68 100
Ped-2 consists of 16 training clips and 12 test clips with 1.6586e-03 89.47 100 87.34
frame size 360 × 240. Apart from these two standard
Figure 5(a) - Abnormal Crowd Activity detection system flow with created dataset
Figure 5(b) - Abnormal Crowd Activity detection system flow with UMN dataset
datasets, we have tested the algorithm with our own created
dataset which consists of activities such as crowd gathering, 4.2.2. Number of Clusters
normal walk as training set and sudden panicking, throwing
abnormal objects, snatch theft, bike movements as K-means clustering algorithm requires the number of
abnormal. clusters to be prefixed before clustering process. It affects
the performance of the system since abnormality is
4.2. Static Parameters Settings predicted from distance the motion influence of the block is
deviated from the normal clusters. The algorithm was
In the proposed framework, there are several parameters, tested with four different number of cluster values. As
such as the block size, threshold of acceptance in the listed in Table 2, it is clear that when number of clusters is
nearest neighbor search module, and K values in the K- 4, the performance of the system is high. Precision is 100%
means clustering, that governs the system performance. indicating that detected abnormal blocks are actually
Experiments were performed to account the effect of abnormal. Clustering happens separately for each block in
varying parameters. the frame. Further, the results from Table 2 show that
– 119 –