
Page 50 - ITU Journal - ICT Discoveries - Volume 1, No. 2, December 2018 - Second special issue on Data for Good
P. 50
ITU JOURNAL: ICT Discoveries, Vol. 1(2), December 2018
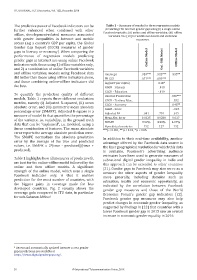
The predictive power of Facebook indicators can be Table 1 – Summary of results for three regression models
further enhanced when combined with other predicting ITU Internet gender gap using (i) a single online
offline, development-related measures associated Facebook variable; (ii) online and offline variables; (iii) offline
variables. See [19] for additional details and statistical
with gender inequalities in Internet and mobile measures.
access (e.g a country’s GDP per capita, the Global
Gender Gap Report (GGGR) measures of gender
gaps in literacy or economy). When comparing the
performance of regression models predicting Online Model Offline Model
gender gaps in Internet use using online Facebook Onl.-Offl. Model
indicators with those using 1) offline variables only,
and 2) a combination of online Facebook variables
and offline variables, models using Facebook data Intercept .933*** .932*** .933**
did better than those using offline indicators alone, FB GGI .071*** .093***
and those combining online-offline indicators did log(GDP per capita) .018*
the best. GGGR - Literacy -.018
GGGR - Education -.019
To quantify the prediction quality of different Internet Penetration .040***
models, Table 1 reports three different evaluation GGGR - Tertiary Educ. .032
metrics, namely (i) Adjusted R-squared, (ii) mean GGGR - Economy .043**
absolute error, and (iii) symmetric mean absolute GGGR - Score -.024
percentage error (SMAPE). Adjusted R-square is a Adjusted R 2 .691 .791 .615
measure of model fit that quantifies the percentage Mean Abs. Error 0.0325 0.0288 0.037
of the variance, i.e. variability, in the ground truth SMAPE 3.92% 3.90% 4.97%
data that can be “explained”, i.e. modeled, using a # predicted countries 152 127 132
linear combination of features. The mean absolute ***p < 0.001, ** p < 0.01, * p < 0.05.
error reports the average absolute prediction error.
The SMAPE normalizes the absolute prediction In addition to their real-time availability, another
error by the average of the true and predicted advantage offered by the Facebook data source is
values, i.e. SMAPE = 2*|true - predicted|/|true + the finer geographical resolution for which this data
predicted|. is available. Facebook’s advertising audience
estimates have been used to generate measures of
Table 1 highlights how all measures of predictive fit subnational digital gender inequality in India and
are best for the online-offline model followed by the this approach can be extended to other countries
online and then offline models. A significant [21]. Gender gaps in Facebook may also serve as a
strength of the online model, which uses a single measure for other aspects of gender inequality
Facebook indicator only, is that it enables more generally, including domains such as
prediction for the most number of countries, with education, health and economic opportunity, as
the biggest gains in coverage made for less indicated by the correlation between Facebook
developed countries. Fig. 2 visually shows the gender gap measures and those of the World
coverage gain compared to ITU data, in particular Economic Forum’s gender gap indicators [22].
for sub-Saharan Africa. Facebook gender gap measures may also help
6
predict changes in economic gender inequality, as
suggested by findings in [22] that countries with a
lower Facebook gender gap in 2015 saw an overall
increase in economic gender equality in 2016.
6 Recent and automatically updated Internet access gender
gaps predictions are available at
https://www.digitalgendergaps.org/.
28 © International Telecommunication Union, 2018