
Page 145 - ITU Kaleidoscope 2016
P. 145
ICTs for a Sustainable World
Table 4. Stretch: Analysis vs. Simulation with α =0.7
and Chunk Size 10MB.
Cache Size Chunk Anal Sim Difference
2
1 1(10 ) 0.56 0.58 0.02
2
2 2(10 ) 0.51 0.54 0.03
2
3 3(10 ) 0.50 0.53 0.03
2
4 4(10 ) 0.49 0.52 0.03
2
5 5(10 ) 0.48 0.50 0.02
2
6 6(10 ) 0.47 0.49 0.02
2
7 7(10 ) 0.46 0.48 0.02
2
8 8(10 ) 0.45 0.47 0.02
2
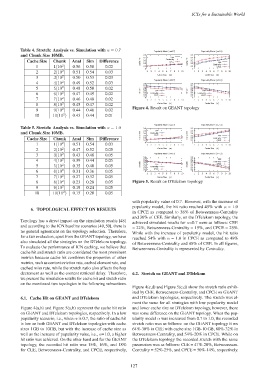
9 9(10 ) 0.44 0.46 0.02 Figure 4. Result on GEANT topology
2
10 10(10 ) 0.43 0.44 0.01
Table 5. Stretch: Analysis vs. Simulation with α =1.0
and Chunk Size 10MB.
Cache Size Chunk Anal Sim Difference
2
1 1(10 ) 0.51 0.54 0.03
2
2 2(10 ) 0.47 0.52 0.05
2
3 3(10 ) 0.43 0.48 0.05
2
4 4(10 ) 0.39 0.44 0.05
2
5 5(10 ) 0.35 0.40 0.05
2
6 6(10 ) 0.31 0.36 0.05
2
7 7(10 ) 0.27 0.32 0.05
2
8 8(10 ) 0.23 0.28 0.05 Figure 5. Result on DTelekom topology
2
9 9(10 ) 0.19 0.24 0.05
2
10 10(10 ) 0.15 0.20 0.05
with popularity value of 0.7. However, with the increase of
popularity model, the hit ratio reached 45% with α = 1.0
6. TOPOLOGICAL EFFECT ON RESULTS
in CPCE as compared to 38% of Betweenness-Centrality
and 36% of CEE. Similarly, on the DTelekom topology, the
Topology has a direct impact on the simulation results [48]
achieved simulated results for α=0.7 were as follows: CEE
and according to the ICN baseline scenarios [49,50], there is
= 22%, Betweenness-Centrality = 19%, and CPCE = 25%.
no general agreement on the topology selection. Therefore,
While with the increase of popularity model, the hit ratio
for a fair evaluation, apart from the GEANT topology, we have
reached 54% with α = 1.0 in CPCE as compared to 49%
also simulated all the strategies on the DTelekom topology. of Betweenness-Centrality and 48% of CEE. In all figures,
To evaluate the performance of ICN caching, we believe that
Betweenness-Centrality is represented by Centrality.
cache hit and stretch ratio are considered the most prominent
metrics because cache hit combines the properties of other
metrics, such as content eviction rate, cached element rate, and
cached miss rate, while the stretch ratio also affects the hop
decrement as well as the content retrieval delay. Therefore, 6.2. Stretch on GEANT and DTelekom
we present the simulation results for cache hit and stretch ratio
on the mentioned two topologies in the following subsections.
Figure 4(c,d) and Figure 5(c,d) show the stretch ratio exhib-
ited by CEE, Betweenness-Centrality, and CPCE on GEANT
6.1. Cache Hit on GEANT and DTelekom and DTelekom topologies, respectively. The stretch was al-
most the same for all strategies with low popularity model
Figure 4(a,b) and Figure 5(a,b) represent the cache hit ratio and lower cache size on DTelekom topology, however, there
on GEANT and DTelekom topologies, respectively. In a low was some difference on the GEANT topology. When the pop-
popularity scenario, i.e., when α is 0.7, the ratio of cache hit ularity model α was increased from 0.7 to 1.0, the recorded
is low on both GEANT and DTelekom topologies with cache stretch ratio was as follows: on the GEANT topology it ws
sizes 1GB to 10GB, but with the increase of cache size as 64%-30% in CEE with cache size 1GB-10 GB, 60%-32% in
well as the increase of popularity value, i.e., α=1.0, a higher Betweenness-Centrality, and 54%-20% in CPCE. While on
hit ratio was achieved. On the other hand and for the GEANT the DTelekom topology the recorded stretch with the same
topology, the recorded hit ratio was 15%, 16%, and 18% parameters was as follows: CEE = 47%-20%, Betweenness-
for CEE, Betweenness-Centrality, and CPCE, respectively, Centrality = 52%-25%, and CPCE = 50%-14%, respectively.
– 127 –