 Simply
understood as the gaps between ICT ‘haves’ and ‘have-nots’, the Digital
Divide represents the newest addition to the enormous chasms in the
stage of development and the standard of living among economies. The ICT
Opportunity Index is the merger of two wellknown initiatives, ITU’s
Digital Access Index (DAI) and Orbicom’s Monitoring the Digital Divide/
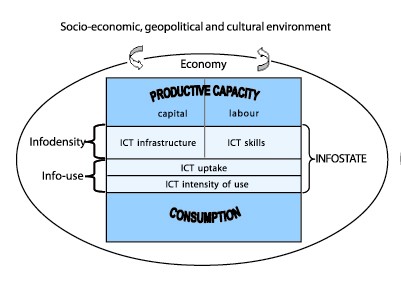
Infostate conceptual framework and model. The conceptual framework of
the index introduces the notions of a country’s infodensity and
info-use. Infodensity refers to the slice of a country’s overall capital
and labour stocks, which are ICT capital and ICT labour stocks and
indicative of productive capacity. Info-use refers to the consumption
flows of ICTs. Technically, it is possible to aggregate the two and
arrive at the degree of a country’s ‘ICT-ization’, or infostate. The
Digital Divide is then defined as the relative difference in infostates
among economies. Thus, Infodensity = sum of all ICT stocks (capital and
labour) Info-use = consumption flows of ICTs/period Infostate =
aggregation of infodensity and info-use It is differences among
countries’ Infostates that constitute the Digital Divide. Since
Infostates are dynamic and ever-evolving, the Digital Divide is a
relative concept. Any progress made by developing countries must be
examined against the progress made by developed ones. The index provides
explicit measurements both across countries at a given point in time
(from 1995 to 2003) and within countries over-time, and allows immediate
benchmarking against the average of all countries (Hypothetica) and the
planet as a whole (Planetia). Hypothetica is an economy with values
equal to the average of all economies covered in the model, and Planetia
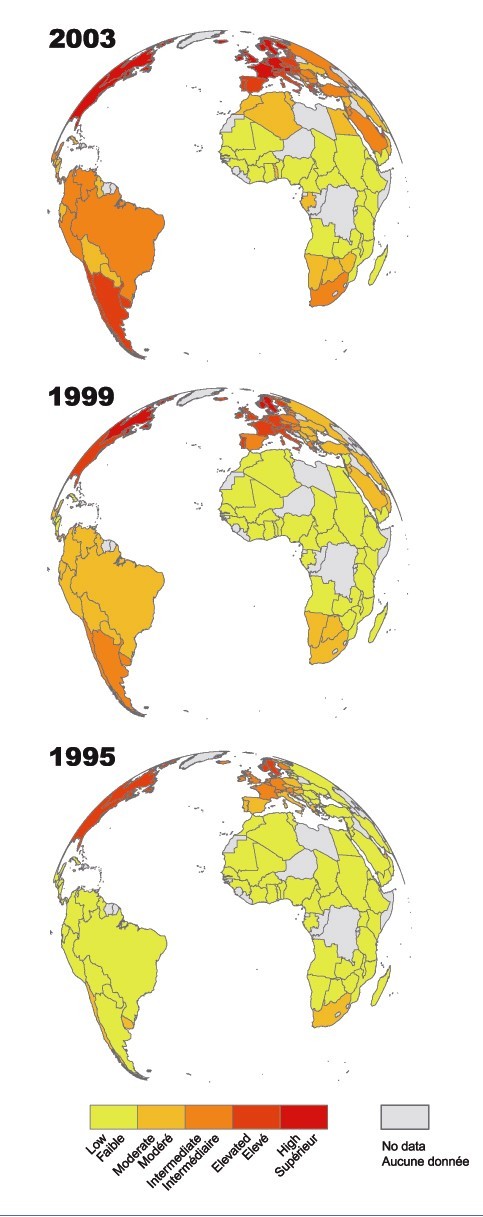
represents the planet at large, as if it were one economy. The Evolution
of the Digital Divide Infostate values for all economies have increased
over the 1995-2003 period, and the infostate values for Hypothetica and
Planetia increased more than two-and-a-half times over the nine-year
period. Differences between the Infostate values for each economy and
Hypothetica are plotted on the chart, providing a first glimpse at the
evolution of the Digital Divide. The 2003 line lies visibly ‘inside’ the
1995 line at the bottom end, while it crosses to the ‘outside’ only at
the very top end. This increased steepness is indicative of a generally
closing Digital Divide. The gap between the very bottom economy (Chad)
and the average closed more than the gap between the very top economy
(Denmark) and the average. Alternatively, the average increased by more
than the top, which means that the Infostates of economies below average
increased proportionately more than the Infostates of highly advanced
economies. Simply
understood as the gaps between ICT ‘haves’ and ‘have-nots’, the Digital
Divide represents the newest addition to the enormous chasms in the
stage of development and the standard of living among economies. The ICT
Opportunity Index is the merger of two wellknown initiatives, ITU’s
Digital Access Index (DAI) and Orbicom’s Monitoring the Digital Divide/
Infostate conceptual framework and model. The conceptual framework of
the index introduces the notions of a country’s infodensity and
info-use. Infodensity refers to the slice of a country’s overall capital
and labour stocks, which are ICT capital and ICT labour stocks and
indicative of productive capacity. Info-use refers to the consumption
flows of ICTs. Technically, it is possible to aggregate the two and
arrive at the degree of a country’s ‘ICT-ization’, or infostate. The
Digital Divide is then defined as the relative difference in infostates
among economies. Thus, Infodensity = sum of all ICT stocks (capital and
labour) Info-use = consumption flows of ICTs/period Infostate =
aggregation of infodensity and info-use It is differences among
countries’ Infostates that constitute the Digital Divide. Since
Infostates are dynamic and ever-evolving, the Digital Divide is a
relative concept. Any progress made by developing countries must be
examined against the progress made by developed ones. The index provides
explicit measurements both across countries at a given point in time
(from 1995 to 2003) and within countries over-time, and allows immediate
benchmarking against the average of all countries (Hypothetica) and the
planet as a whole (Planetia). Hypothetica is an economy with values
equal to the average of all economies covered in the model, and Planetia
represents the planet at large, as if it were one economy. The Evolution
of the Digital Divide Infostate values for all economies have increased
over the 1995-2003 period, and the infostate values for Hypothetica and
Planetia increased more than two-and-a-half times over the nine-year
period. Differences between the Infostate values for each economy and
Hypothetica are plotted on the chart, providing a first glimpse at the
evolution of the Digital Divide. The 2003 line lies visibly ‘inside’ the
1995 line at the bottom end, while it crosses to the ‘outside’ only at
the very top end. This increased steepness is indicative of a generally
closing Digital Divide. The gap between the very bottom economy (Chad)
and the average closed more than the gap between the very top economy
(Denmark) and the average. Alternatively, the average increased by more
than the top, which means that the Infostates of economies below average
increased proportionately more than the Infostates of highly advanced
economies.
 Many
economies made quite significant improvements, others more modest and,
generally, Infostates increased each and every year - with a few minor
exceptions. The economies with the highest growth rates are those with
the most room to grow – that is, economies with the lowest Infostates.
The Sudan led economies in Infostate growth, followed by many African
economies, including Côte d’Ivoire, Togo and Ethiopia. By the same
token, economies with comparatively lower growth are typically economies
with highly advanced Infostates, including the U.S., Canada,
Scandinavian and other European economies. The example of Sudan and
Qatar is also an interesting one: Sudan achieved an Infostate value of
29.1 in 2003, which was the value for Qatar in 1995. Similarly,
Nicaragua’s 1995 Infostate value was identical to Uganda’s 2003 value –
it took nearly a decade for Uganda to reach Nicaragua, although by then
Nicaragua had moved up to 48.5. Malaysia (110.9 in 2003) is also nearly
ten years behind the top economy Denmark (109.7 in 1995), but an almost
equal time distance ahead of India. The timeline of Infostate values
reveals that, all things being equal, literally decades are needed for
the economies with low Infostates to catch up to the top economies. Many
economies made quite significant improvements, others more modest and,
generally, Infostates increased each and every year - with a few minor
exceptions. The economies with the highest growth rates are those with
the most room to grow – that is, economies with the lowest Infostates.
The Sudan led economies in Infostate growth, followed by many African
economies, including Côte d’Ivoire, Togo and Ethiopia. By the same
token, economies with comparatively lower growth are typically economies
with highly advanced Infostates, including the U.S., Canada,
Scandinavian and other European economies. The example of Sudan and
Qatar is also an interesting one: Sudan achieved an Infostate value of
29.1 in 2003, which was the value for Qatar in 1995. Similarly,
Nicaragua’s 1995 Infostate value was identical to Uganda’s 2003 value –
it took nearly a decade for Uganda to reach Nicaragua, although by then
Nicaragua had moved up to 48.5. Malaysia (110.9 in 2003) is also nearly
ten years behind the top economy Denmark (109.7 in 1995), but an almost
equal time distance ahead of India. The timeline of Infostate values
reveals that, all things being equal, literally decades are needed for
the economies with low Infostates to catch up to the top economies.
Source:
“From the Digital Divide to DIGITAL OPPORTUNITIES: Measuring Infostates
for Development”, Orbicom/ITU, 2005, Dr Sciadas (ed) |