|
Newly released data
from ITU's ICT Price Basket (IPB) show that ICT services are getting
more affordable worldwide
NEW
Key highlights
- Consumers are paying 18% less for ICT services than they were two years ago
- The price for
high-speed Internet connections dropped by 52% between 2008 and
2010, compared to a 22% drop in prices for mobile cellular services
(Table
1)
- In developing countries, fixed
broadband prices dropped by 52%, compared to 35% in developed
countries (Chart 1)
- Countries with the relatively cheapest
broadband prices are high-income economies and include Monaco, Macau (China), Liechtenstein, the US and
Austria
- In 2010, the cost of ICT
services averaged 1.5% of GNI per capita in developed countries,
compared to 17% of GNI per
capita in developing countries (see Chart 2)
- Customers in 31 countries – all of them highly industrialized economies
– pay only the equivalent of 1% or less of average monthly GNI per capita for an
entry-level broadband connection but in 19 countries, a broadband
connection costs more than 100% of monthly GNI per capita.
-
Relative overall prices decreased by over 50% in Azerbaijan, Bhutan,
Sri Lanka, Bangladesh, Venezuela, Guyana, Uganda and Austria (Table
2, left)
-
Nine out of the top ten countries showing the greatest decrease in
the ICT Price Basket value were from Africa - of them
had high values (i.e. high prices) to begin with (Table 2, right)
-
While ICT prices are falling in all regions of the world, the
greatest price drops occurred in Africa, where fixed broadband
prices fell by over 55% and mobile cellular prices by 25%...
|
Table
1: ICT Price Basket and sub-baskets, 2008 and 2010
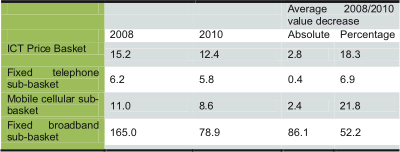
Source: ITU
Chart 1:
Fixed broadband sub-basket by level of development,
2008 and 2010
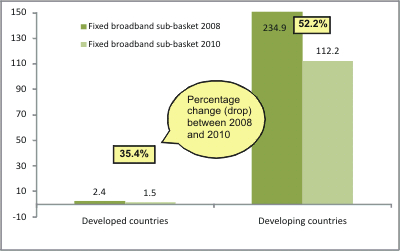
Source: ITU
Chart 2: ICT
Price Basket by level of development, 2008 and 2010
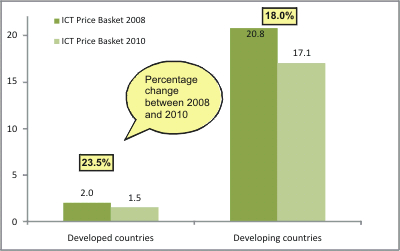
Source: ITU |
|
About the IPB
ITU’s ICT Price Basket (IPB)
is a composite affordability measure based on three sub-baskets – fixed
telephone, mobile cellular and fixed broadband Internet services – and computed
as a percentage of average Gross National Income (GNI) per capita. As a
comprehensive benchmarking tool, the IPB monitors the relative price of ICT
services and provides an indication of how affordable services are across
countries, and over time.
Published annually, the latest
IPB compares 2008 and 2010 tariffs at global and regional levels and highlights
the difference in prices between developed and developing regions. Covering 165
economies, it is the only price basket to monitor the affordability of ICT
services worldwide.
Data from ITU's
2010 IPB were released at the WSIS Forum 2011. The full details
and results of the 2010 IPB will be released in September 2011,
in the Measuring the Information Society Report 2011.
|
Table 2: Ten economies with the greatest decrease in the ICT Price
Basket,
sorted by relative change (top) and value change (bottom)
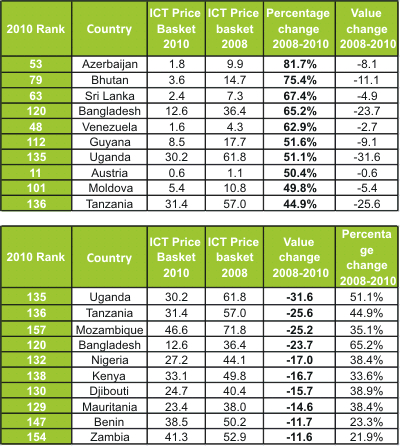
Source: ITU
Chart 3:
ICT sub-baskets by region and by level of development,
2008 and 2010
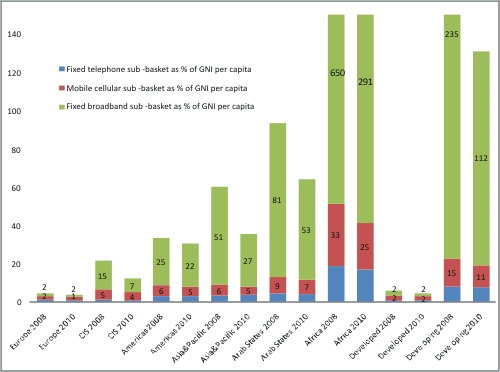
Note: The IPB is a composite basket that includes three tariffs
sets, referred to as sub-baskets: fixed telephone, mobile cellular
and fixed broadband Internet services. The IPB is the value derived
from the sum of the price of each sub-basket as a percentage of a
country’s monthly GNI per capita, divided by three. The cost of each
sub-basket as a percentage of monthly GNI per capita is limited
to/capped at a maximum value of 100, so that the final price basket
value may vary between a theoretical ‘zero’ (ICT services are for
free) and 100 (the price of all three sub-baskets is equal to, or
exceeds, the monthly GNI per capita). However, the three sub-baskets
, as presented in this chart, are not capped at a maximum of 100 and
in the case of fixed broadband, some countries exceed 100 (i.e. the
cost of fixed broadband services exceeds the monthly GNI per
capita).
Source: ITU |

